Visora AI Data Visualization Dashboard: A Modern Template for Clarity
Imagine opening your analytics platform not to a chaotic spreadsheet, but to a clean, futuristic command center where every metric, trend, and insight is presented with absolute clarity. This is the promise of a well-designed dashboard, and it’s precisely the experience the Visora AI Data Visualization Dashboard template delivers. For designers and business owners tasked with creating tools for business intelligence, reporting, or enterprise data management, this template offers more than just a pretty interface—it provides a foundational language for presenting complex information elegantly and effectively.
A Blueprint for Modern Business Intelligence
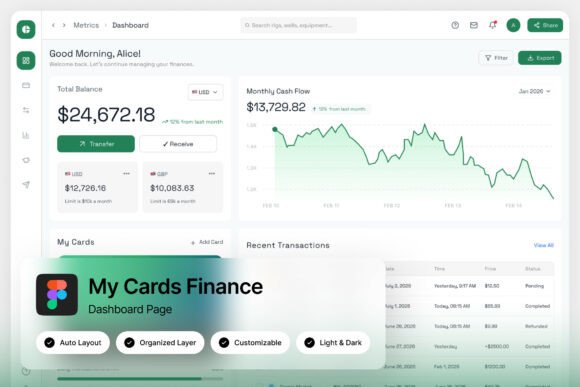
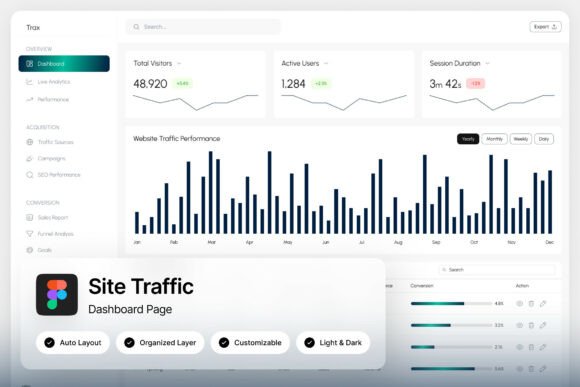
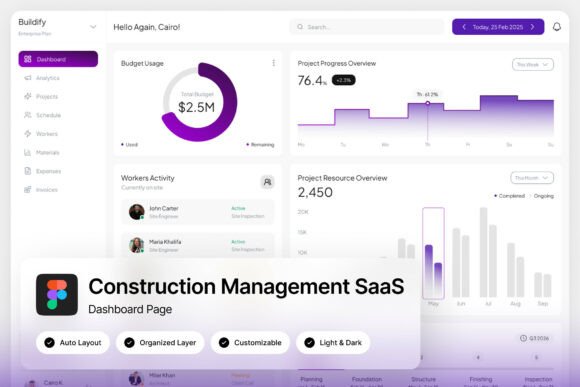
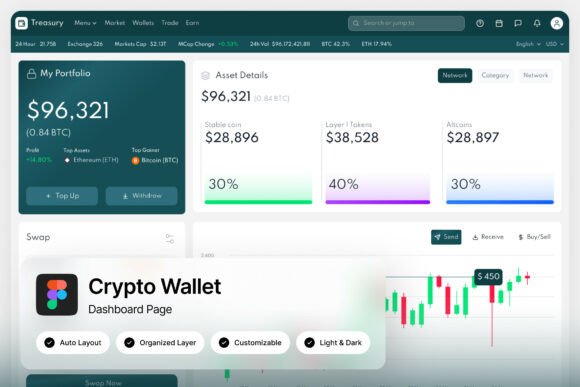
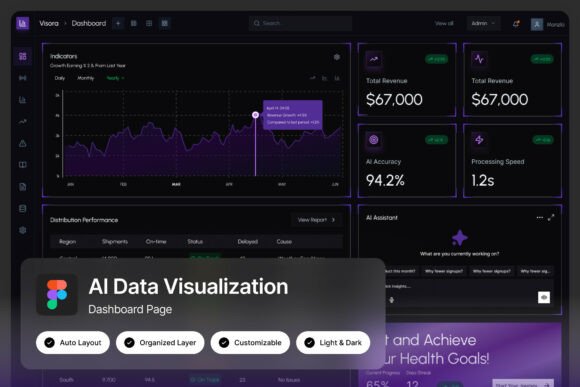
At its core, Visora is a UI kit built in Figma, featuring two high-resolution admin dashboard screens. The design philosophy is rooted in a clean, modern aesthetic that prioritizes data legibility without sacrificing visual appeal. The layouts are pixel-perfect, with well-organized layers that make customization straightforward. This isn’t just a static mockup; it’s a fully editable starting point for creating your own analytics monitoring system or reporting tool. The inclusion of both light and dark mode interfaces is a thoughtful touch, acknowledging that users often have different preferences depending on their environment or the nature of the data they’re reviewing—dark mode for focused, prolonged analysis, and light mode for quick, printed reports.
The visual appeal of Visora lies in its sophisticated use of space, color, and typography. Elegant visualization layouts transform raw data into intuitive charts and graphs, while advanced analytical UI components—think interactive filters, date range selectors, and data table structures—provide the functionality that end-users expect. For a designer, this means you’re not starting from a blank canvas. You have a robust, professionally crafted system that demonstrates best practices in information hierarchy and interaction design.
From Dashboard Design to Brand Identity
While the primary application is clear, the design principles embedded in the Visora template have broader implications for visual communication. The consistent use of typography, color palettes, and component styling is a masterclass in building a cohesive visual system. This is invaluable for anyone working on brand identity. The same thinking that makes a data table readable on a dashboard can be applied to organizing information on a website, a product packaging label, or a marketing brochure.
Consider the challenge of creating a brand style guide. The Visora dashboard, with its meticulous layer organization and defined visual hierarchy, can serve as a living reference. The way it handles headings, subheadings, body text, and data labels establishes a clear typographic scale. The color system, likely built with accessibility and contrast in mind, can inspire a brand’s primary and secondary palette. For a small business owner or entrepreneur, having a tool that visually demonstrates these principles is incredibly powerful for briefing designers or making informed decisions about your own brand’s look and feel.
Furthermore, the futuristic yet professional aesthetic lends itself to industries that want to project innovation and reliability—think fintech, SaaS, health tech, or sustainable energy. The clean lines and ample whitespace convey a sense of order and trustworthiness, which is crucial for any business dealing with sensitive data or complex services. This design language can be extended to your social media graphics, website hero sections, and even the layout of digital products like e-books or online courses, ensuring your audience perceives your brand as both cutting-edge and dependable.
Practical Applications Beyond the Screen
The utility of a resource like Visora extends far beyond building a literal data dashboard. Designers can deconstruct the template to source high-quality UI components for other projects. The buttons, form elements, navigation bars, and card layouts are all designed to a professional standard and can be adapted for use in mobile app design, web design, or even editorial design for tech magazines or annual reports.
For content creators and marketers, the dashboard’s layout principles are directly applicable. How information is chunked, how calls-to-action are placed, and how visual flow guides the user’s eye are all lessons that can improve the effectiveness of a landing page, an email newsletter template, or a social media carousel. The template essentially provides a library of pre-solved design problems. Instead of wrestling with how to best display a set of statistics in a blog post, you can reference the Visora layout for inspiration, adopting its clean chart styles or its method of pairing icons with key figures.
Even in print, the influence is palpable. The balanced composition and modern typography seen in the dashboard are perfect for designing professional presentations, investor pitch decks, or conference posters. The aesthetic is versatile enough to feel at home in a corporate boardroom yet modern enough for a creative startup’s marketing materials. It bridges the gap between functional data display and compelling visual storytelling.
Leveraging the Asset for Your Workflow
To get the most out of a template like Visora, approach it as a design system rather than just a finished product. The fact that it comes with a Figma file means you can dive into the components, understand how they’re built, and modify them to fit your specific needs. The named and grouped layers are a huge time-saver, allowing you to quickly isolate a specific chart style, a particular data card, or a set of icons to use elsewhere in your projects.
A key piece of practical advice is to pay close attention to the included font links. Typography is the backbone of any design system, and using the same typefaces will ensure visual consistency when you adapt elements. Test the font pairings recommended in the template. See how a bold, geometric sans-serif for headings works with a clean, neutral sans-serif for body text. This experimentation will build your intuition for matching typography to project goals—whether you need a typeface that feels authoritative, approachable, or innovative.
Remember, while the template provides a fantastic starting point, your unique value comes from how you customize and apply it. Use it to prototype your own SaaS dashboard, to design a unique analytics portal for a client, or to simply learn how a top-tier UI is constructed. The included help guide and font links are there to smooth the learning curve, making professional-grade design assets more accessible to entrepreneurs and creators who might not have a formal design background.
Ultimately, the Visora AI Data Visualization Dashboard is more than a collection of screens. It’s a toolkit for thinking about how to present information with clarity, sophistication, and purpose. Whether you’re building the next great analytics platform, crafting a brand identity that communicates data-driven intelligence, or simply seeking inspiration for cleaner, more effective layouts, it offers a tangible resource grounded in modern design best practices. It’s a reminder that in our data-saturated world, how we visualize information is not just a technical challenge, but a profound opportunity to connect, inform, and inspire.