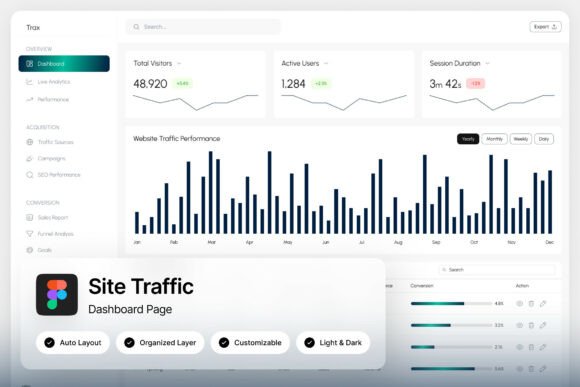
Trax Site Traffic Dashboard: Clarity for Growth Teams
Imagine opening your analytics platform on a Monday morning, coffee in hand, and instead of being met with a chaotic wall of numbers and confusing charts, you see a clean, calm interface. The data you need—visitor trends, where your traffic is coming from, how people are engaging—is presented in a light blue-and-white layout that feels intuitive at a glance. This is the core promise of the Trax Site Traffic Dashboard, a UI design that prioritizes speed and clarity for anyone who needs to make sense of web performance data quickly.
A Design Built for Real Work, Not Just Looks
For web analysts, growth hackers, and marketing teams, a dashboard is their command center. The Trax design understands this. It features visitor trend charts that show growth (or dips) over time without requiring you to squint. Session breakdowns are cleanly organized, letting you see at a glance whether users are new or returning, and how long they’re staying. Traffic source summaries are presented in a way that immediately highlights your top channels—be it organic search, social media, or direct visits—so you can double down on what’s working. The engagement metrics are integrated seamlessly, giving you a holistic view of not just who is coming, but what they’re doing once they arrive.
This focus on practical utility makes it more than just a pretty mockup. It’s a blueprint for functional design. The pixel-perfect layout and well-organized, named layers in the Figma file mean that for a designer or product team, this isn’t just inspiration—it’s a starting point you can actually build upon. You’re not just getting a static image; you’re getting a customizable asset that respects your workflow.
From Analytics Tool to Brand Asset
While the primary use case is for SaaS designers and product teams building traffic monitoring or SEO reporting tools, the principles behind Trax have broader applications. Think about the visual language of your brand. The clean, minimal aesthetic—characterized by ample white space, a restrained color palette, and clear typography—communicates professionalism, efficiency, and trust. These are qualities any business wants to project.
Consider how this design philosophy translates to other areas:
- Brand Identity & Presentations: The same clarity used in the dashboard can inform the design of internal reports, client presentations, or investor decks. Using a consistent, clean visual style across all your materials strengthens brand recognition and makes complex information more digestible.
- Website & Web Design: The layout principles—logical grouping of information, a clear visual hierarchy, and fast data reading—are directly applicable to designing landing pages, feature comparison tables, or user onboarding flows. A visitor should understand your value proposition as quickly as they understand their site traffic.
- Marketing Assets & Social Media Graphics: The light blue-and-white color scheme is versatile and professional. It can be adapted for social media templates, email newsletter designs, or digital ads that need to convey data or credibility without feeling cluttered. The emphasis on minimalism ensures your message isn’t lost in visual noise.
Practical Considerations for Implementation
If you’re considering using the Trax dashboard as a foundation for your project, a few practical steps will ensure success. First, think about your specific data story. What are the two or three most critical metrics for your audience? The Trax layout provides a structure, but you’ll need to customize the data points to match your goals. The easy-to-edit layers in the Figma file are designed for this.
Second, typography is key to its clean feel. The included free Google Fonts guide ensures you can maintain that sharp readability. When adapting the design, stick to a maximum of two font families—one for headings and one for body text—to preserve the uncluttered look. Test your font pairings at different sizes to ensure legibility, especially for the smaller metric labels and chart annotations.
Finally, consider the two modes provided: light and dark. The light mode is ideal for bright office environments and feels more traditional for corporate SaaS tools. The dark mode, however, is increasingly popular, can reduce eye strain for users who spend long hours analyzing data, and often makes data visualizations pop. Offering both, or choosing the one that best fits your brand’s personality, is a valuable feature.
Why This Approach Resonates
In a market saturated with overly complex analytics tools, a design like Trax is a breath of fresh air. It acknowledges that the goal of a dashboard isn’t to show every possible data point, but to surface the right insights quickly. For a small business owner or a solo marketer, this means less time wrestling with the tool and more time making informed decisions. For a designer, it provides a solid, professional framework that can be adapted to countless projects beyond analytics—think editorial layouts for reports, packaging design for tech products, or even digital product interfaces where clarity is paramount.
The value isn’t just in the two high-quality screens you receive; it’s in the design system they represent. It’s a study in how to present information effectively, a skill that translates directly to creating better web design, more engaging social media graphics, and more persuasive marketing assets. By starting with a foundation that prioritizes user understanding, you set the stage for any visual communication to be more effective, whether it’s a live dashboard or a printed poster summarizing your annual growth.